What is GIS, and how did it help you this year?
Dec. 31, 2020
For most Minnesotans, the COVID-19 pandemic is the first time they’ve faced a crisis on such a large scale. Many of us found ourselves at home for weeks or months, worrying about our own wellbeing and that of our loved ones. In such uncertain times, one thing that helps immensely is information. Data. An honest, visual representation of what is going on beyond our doorstep.
The Department of Public Safety division of Homeland Security and Emergency Management (DPS-HSEM) understood the need for information and, with staff from other agencies such as the Minnesota Department of Health, the Governor’s Office and the Minnesota National Guard, got to work in the State Emergency Operations Center (SEOC). There they used Geographical Information Systems (GIS) technology to collaborate on the daily situational awareness dashboards that would paint an overall picture of the COVID response in the state.
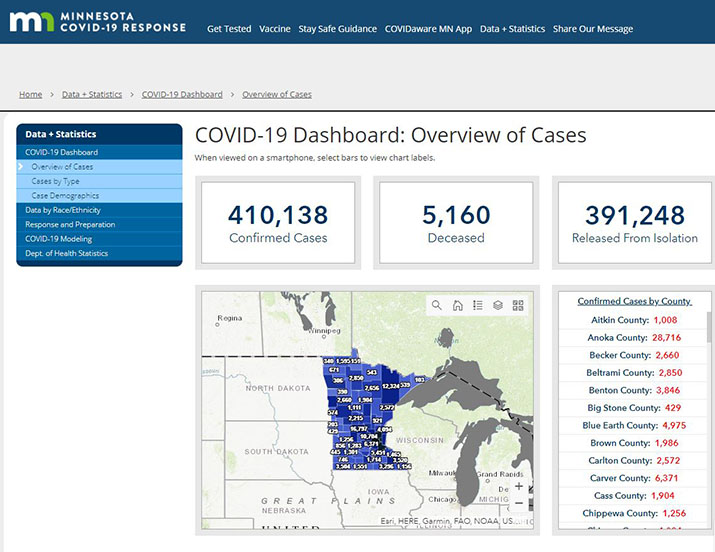
Simply put, GIS technology allows us to capture, store, analyze and manage data associated with a specific geographic location, such as the entire state of Minnesota and its 87 counties. The GIS system allows state agencies to track and analyze data, determine mass testing needs, and present information related to COVID-19 and the state’s response both inside and outside of the firewall. Furthermore, the system allows the state to present complex information in a way that people like you and your family can understand.
This first-of-its-kind collaborative work resulted in multiple dashboards people view every day, which present numerous charts and graphs detailing county case numbers, testing data, long-term care facility tracking, hospital capacities, critical care supply inventories and much more. In fact, if you’ve visited either the MDH Situation Update for COVID-19 or the Governor’s Stay Safe Minnesota websites, you’ve looked at the result of this GIS collaboration among a multitude of partners.
HSEM and its partners at the SEOC are committed to being transparent about the state’s COVID-19 response efforts. These dashboards ensure that the public, the media and our partners have the access they need to make the right decisions for their loved ones during this pandemic. And it’s not just people here in Minnesota that benefit from this GIS collaboration. It also helps the state present data to federal government agencies, such as the Department of Health and Human Services, FEMA, and the Centers for Disease Control and Prevention.
Without this collaboration among state agencies, these dashboards with their valuable information wouldn’t exist. Presenting the data behind Minnesota’s COVID-19 response in a user-friendly way will serve as a model for information delivery for future emergencies.